
Your visitors already found the treasure. They clicked your ad, read your page, added a product to the cart, and then vanished like pixies at sunrise. Conversion rate optimization CRO is how a careful mage guards that hoard, not by casting random button color spells, but by watching a scoreboard, naming one leak, testing one fix fairly, and refusing to crown a shiny fluke as king.
Table of Contents
- The Hoard Conversion Rate Optimization Protects
- Scoreboard Metrics Every CRO Mage Tracks
- Checkout Hypotheses and Accessibility Charms
- A/B Spells Versus Multivariate Rituals
- The Tool Stack That Keeps the Scoreboard Honest
- When the Oracle Should Not Crown a Winner
- A Weekly Roadmap for Continuous Optimization
- Launch Your First Supervised Experiment
The Hoard Conversion Rate Optimization Protects
Say a small candle shop gets shoppers all week. Baskets fill up. Then most shoppers reach the gate, spot an unexpected delivery fee, get asked to invent a password, and slip away. The shopkeeper blames the candle photos. The dragon is sitting in checkout, eating orders.
That scene is normal at scale. The Baymard Institute compilation of 50 studies reports an average global cart-abandonment rate of 70.22%, meaning roughly seven in ten carts do not become completed orders, and Baymard has tracked checkout usability for more than 14 years across hundreds of leading U.S. and European e-commerce sites. This isn't a bad week. It's a structural leak in the hoard.
What Conversion Rate Optimization CRO Means in Plain Words
Conversion rate optimization CRO means raising the share of visitors who finish one chosen action, such as a purchase, a signup, or a qualified lead. You do it by cutting uncertainty, removing needless steps, and comparing each change against your current page instead of guessing. The chosen action matters. A shop counts orders. A course seller counts paid signups. Software counts qualified demos, not every curious click that wanders in wearing a wizard hat.
Read those abandonment causes and the job gets concrete. Shoppers leave because extra costs feel too high, because account creation blocks them, because delivery looks slow, or because checkout feels long and tangled. Each cause points to a different fix, and none of them is solved by arguing about a button shade for an afternoon.
- Surprise cost: Show shipping, taxes, and fees early, before payment turns into an ambush.
- Forced account: Let new buyers check out as guests, then invite account creation after the order.
- Slow delivery doubt: State delivery timing in plain language near the price and again at checkout.
- Long checkout: Cut fields you don't need for the order in front of you.
A button color is a pixie. A hidden fee is a dragon. Hunt the dragon first.
Baymard estimates the average large e-commerce site could achieve a 35.26% increase in conversion rate through checkout design improvements alone. Treat that as a modeled improvement opportunity, not a guaranteed enchantment for your store. Your page, traffic, and prices differ, so your result needs its own evidence.
The Spell Order
Work in this order and you won't chase glitter. First, read a weekly scoreboard so you know which step leaks. Second, write a hypothesis that names the page, audience, change, and metric. Third, run a fair test or a monitored before and after if traffic is thin. Fourth, promote, retire, or rerun, and write down why.
That order sounds almost boring, and that's its strength. Magic in this guide means supervised treasure hunting. Familiars can watch, draft, and route traffic, but a person still checks the map before anyone declares the gold found. Your map comes first, the scoreboard that tells you where visitors stall.
Scoreboard Metrics Every CRO Mage Tracks
Start with one tiny sum before you touch any page. Say your shop records 40 orders from 2,000 sessions. That's 40 divided by 2,000, or a 2% primary conversion rate. If a change lifts you to 2.4% on the same traffic, you get 48 orders, which is eight extra orders. Not a vibe. Not a prettier chart. Eight paid trips through the dragon's gate.
That formula is the heart of the scoreboard. Primary conversion rate equals completed goals divided by sessions. Pick one money metric per page and defend it like a ward stone. A product page in a shop answers for orders. A course sales page answers for paid signups. A software demo page answers for qualified demos, because a demo booked by a student with no budget isn't treasure, it's a goblin in a crown.
Helper Rates Locate the Leak
The primary rate tells you whether the hoard grew. Helper rates tell you where the floorboards creak. Add-to-cart rate checks whether the product page, price, and trust signals persuade anyone to start. Checkout-start rate checks whether cart visitors even enter checkout. Checkout completion checks whether people who start payment finish it. Revenue per session catches a sneaky trade, where more people buy but each order shrinks so much that you earn less.
Read them as a chain, not as separate trophies. If add-to-cart is healthy and checkout completion is weak, your product page isn't the first suspect. If checkout starts collapse right after you show delivery charges, the cart page needs attention before you rewrite a headline.
| Metric | Formula | Practical read | A weak result usually means |
|---|---|---|---|
| Primary conversion rate | Goals divided by sessions | One money goal per page, judged on a matched weekday window | Offer, audience, or page friction, not a single color tweak |
| Add-to-cart rate | Add-to-cart events divided by sessions | Trend versus your own baseline | Product page, price, or trust problem before checkout |
| Checkout-start rate | Checkouts started divided by carts | Shows who even enters the gate | Cart-page fees, delivery shock, or a dead button |
| Checkout completion | Purchases divided by checkouts started | The dragon's gate; design fixes are where Baymard models a 35.26 percent opportunity | Surprise cost, long forms, forced accounts, or slow delivery |
| Revenue per session | Revenue divided by sessions | Catches a higher rate that sells cheaper orders | Discounting or low-intent traffic inflating the rate |
| Guardrail | Refunds, chargebacks, or unqualified leads as a share of conversions | Must not worsen when the primary rate rises | A false win that poisons the hoard |
Why a Sitewide Average Can Lie
A single blended rate hides the creatures inside it. Mobile visitors might convert well below desktop visitors because a form is cramped on a phone. Returning customers might breeze through while new visitors stall on delivery questions. Paid traffic from a broad campaign might drag the total down even while organic visitors improve.
So split the scoreboard before you celebrate. Read mobile and desktop separately. Read new and returning separately. Read paid and organic separately. A change that lifts the total while hurting mobile buyers has not won cleanly. It's won on one road and set a trap on another.
Reading rule: Compare the same weekday window, ignore a single lucky day, and never judge a rate alone.
Pair every primary rate with a guardrail. Shops watch refund rate. Software teams watch qualified lead rate. Course sellers watch refund requests and chargebacks. If orders rise because your promise got vaguer and refunds rise with them, the hoard is leaking out the back wall.
Confusion usually starts when readers compare their rate with a stranger's rate. Don't. A candle shop, a coach, and a software company ask visitors for different commitments. Your useful benchmark is your own baseline, read over a matched window, split by the segments that buy. Once one cell on that scoreboard turns red, you have a place to aim. The next job is naming a precise hypothesis for that leak instead of redesigning the whole castle.
Checkout Hypotheses and Accessibility Charms
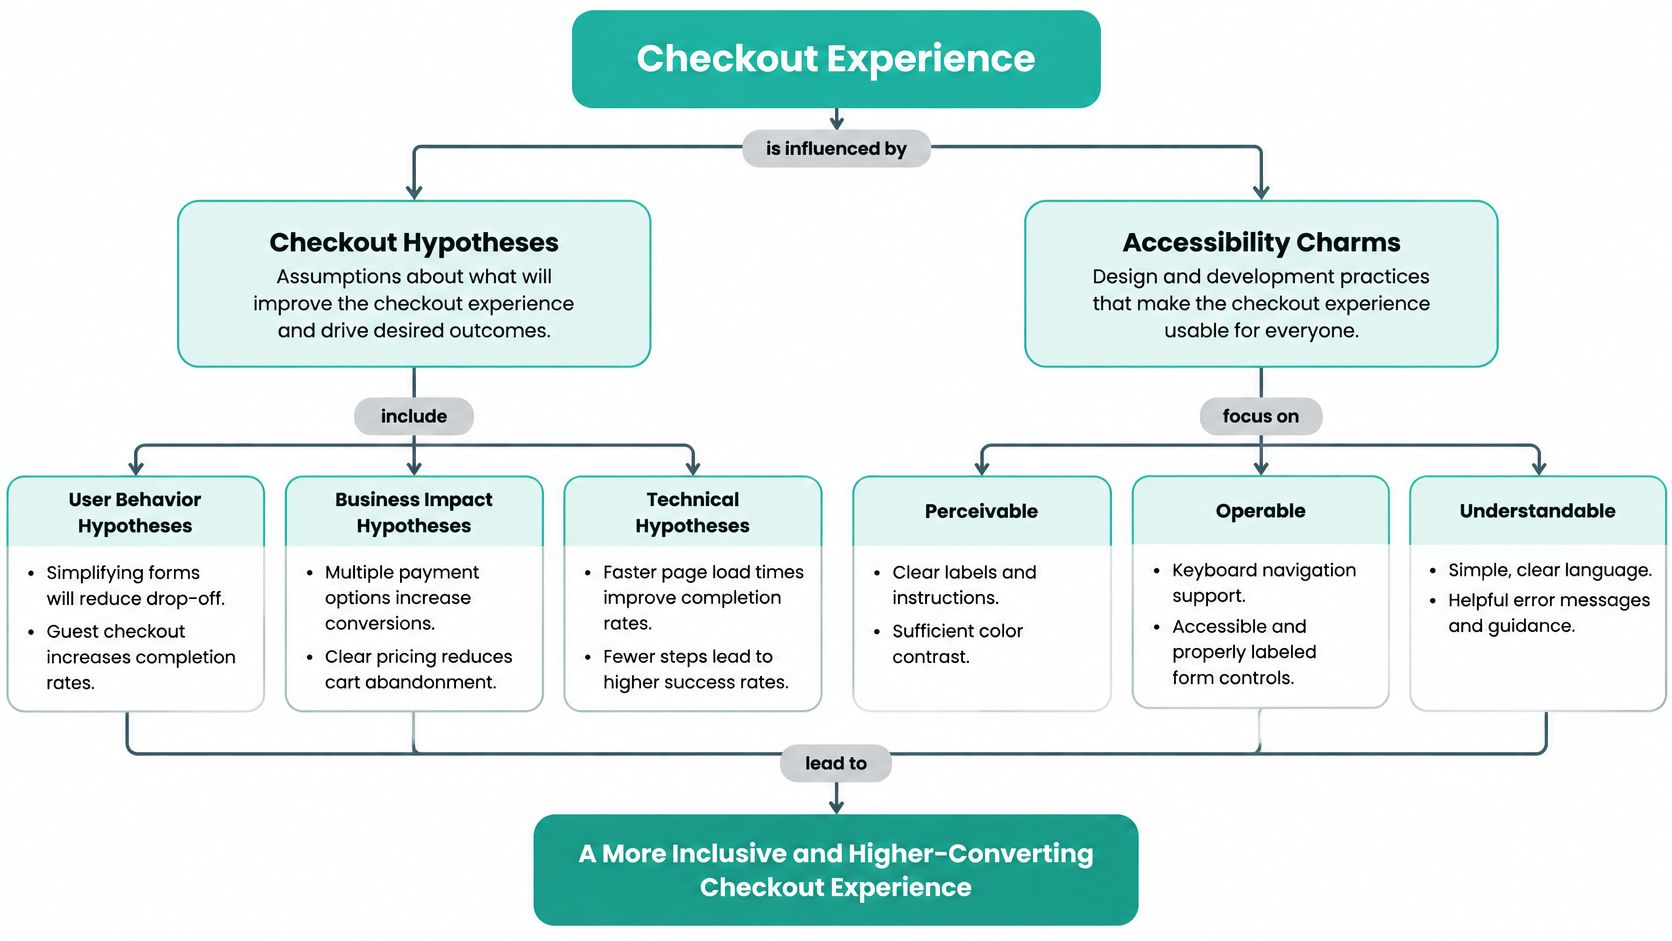
Checkout is the dragon at the gate, and most dragons here are made of form fields. The Baymard checkout usability benchmark found the average US checkout displays 23.48 form elements by default, while moderated usability testing found an effective checkout flow can be reduced to as few as 12 elements, made of 7 form fields, 2 checkboxes, 2 dropdowns, and 1 radio-button interface. That gives you a target shape, not a vague wish to make things easier.
A hypothesis turns that target into a testable claim. Write it in four beats, every time. State what you observed, name the suspected cause, pick one change, and choose the metric that should move. If you can't fill in all four beats, you're not ready to cast. You're still wandering the forest with a wand and a hunch.
Use this line and fill every bracket. On [page], changing [element] for [audience] will lift [metric] because [reason]. Keep it in your decision log exactly as written, so future you doesn't rewrite history after the chart wiggles.
Here's a visual map of how a checkout hypothesis and an accessibility fix work together at the gate.
Three Ready Hypotheses
Early total hypothesis: On the cart page, showing shipping and tax before payment for new mobile visitors will lift checkout completion because surprise fees ambush buyers late. Keep the product price, discount, and delivery promise unchanged, or you won't know which spell worked.
Guest checkout hypothesis: On checkout, offering guest checkout instead of a forced account for new visitors will lift purchases divided by checkouts started because password invention adds effort before trust exists. Keep delivery timing visible on both versions. If you hide a slow delivery date to win the test, refunds become your guardrail alarm.
Shorter form hypothesis: On mobile checkout, moving toward the 12-element shape with inline error text will lift form completion because fewer fields and clearer corrections reduce effort. Inline error text sits beside the field and says what to fix, such as a missing postcode digit. A red outline alone is a riddle, and riddles belong to trolls, not payment forms.
Watch the edge case before you shorten anything. Don't hide a legally required choice, a subscription term, or a delivery promise just to make the form look sleek. A shorter form that creates confused buyers is a cursed shortcut. If you want a deeper walkthrough of the gate itself, our guide to checkout page optimization breaks the steps down in order.
The Accessibility Charm Most Teams Skip
Accessibility isn't a side quest for a tiny audience. A 2025 scan of 84 major ecommerce cart and checkout URLs found that only 11% met WCAG guidelines, while 89% of U.S. ecommerce cart pages had critical violations. When nearly nine in ten cart pages carry critical violations, some of your abandonment isn't persuasion failing. It's people being locked out by the door handle.
Prioritize fixes that unblock the task. Make every control reachable by keyboard navigation in a sensible order. Keep visible focus states so keyboard users can see where they are. Use real form labels tied to fields, not placeholder text that vanishes as you type. Write error messages that explain the fix, check contrast on buttons and small print, and give the pay button a clear screen reader name.
These charms help far beyond screen reader users. Larger tap targets help a parent buying with one hand. Clear error recovery helps an older customer and a tired founder alike. Predictable navigation helps anyone checking out on a bumpy train with a pixie sized attention span.
Measure the charm fairly. Don't ship an accessibility fix beside a discount and then credit the fix for every extra order. Test or monitor one change, watch form completion and error rates by device, and run a manual task check with keyboard only. Archive each attempt as hypothesis, variant, result, and decision, so the next mage inherits a spellbook, not folklore.
A/B Spells Versus Multivariate Rituals
Pick the ritual by the question you're asking, not by which tool looks fancier. An A/B test splits visitors between your current page and one challenger, then compares the same primary goal on both. An A/B/n test splits visitors among a few distinct challengers. A multivariate test changes several elements together, such as headline, hero image, and offer, so you can see combinations. That last one sounds powerful, and it is, but every extra element multiplies the versions your traffic must feed.
The short comparison below puts the two classic rituals side by side before you open any tool.

For most small sites, one bold A/B change is the honest choice. Say your hypothesis targets forced accounts. Send half your visitors to the current page and half to the guest checkout challenger, keep everything else steady, and read purchases divided by checkouts started. You learn one clean thing. A multivariate ritual on the same thin traffic would spread visitors across so many combinations that the test grows old and grey before it answers.
| Method | What changes | Best when | Main risk |
|---|---|---|---|
| A/B | Control versus one challenger | One clear hypothesis on a normal-traffic page | Peeking or too small a change to detect |
| A/B/n | Control versus several challengers | A few distinct offers, not tiny tweaks | Traffic split too thin to crown anyone |
| Multivariate | Several elements combined | High traffic and a real question about interactions | Version count explodes and the test never finishes |
| Do not test yet | A broken control | Legal price errors, dead buttons, or no converting traffic | A ritual that delays an obvious fix |
A Million Tests Don't Excuse Peeking
This practice is mature, not fringe. A VWO analysis of A/B and multivariate tests examined approximately 1,000,000 paused and completed A/B and multivariate tests conducted across 100,000 websites and 16 industries during January through December 2022. In an A/B test, visitors are split between a control and one or more variants, and outcomes such as purchases, sign-ups, or qualified leads are compared using conversion rates and statistical confidence. Volume that large proves the method is mainstream. It doesn't make your individual test wise.
Volume is not wisdom: A test with no hypothesis is just two pages and a coin flip wearing robes.
Before launch, write down five things. Name the hypothesis and the pre-chosen primary metric. Set a planned duration and a traffic split. Then decide which segments you'll check afterward, such as mobile, country, language, or traffic source, because an aggregate winner can hide a segment level loss. That last check matters for global sellers. A challenger that wins with desktop buyers at home and loses with mobile buyers abroad isn't a clean champion.
This short video walks through the split mechanically, which helps if the traffic routing still feels abstract.
The common trap is stopping the moment a chart turns green. Early green often means a few lucky orders landed on one side. Stopping there mints false champions, and false champions get promoted to every visitor, where their luck runs out in public. Let the test reach the sample and duration you wrote down.
Save multivariate work for high traffic pages where the interaction itself is the question, for example whether a bold headline only works beside a specific offer. For a fuller grounding in setup choices, see our notes on A/B testing for websites. Everyone else should cast one clear A/B spell, read it, and only then reach for a bigger ritual.
The Tool Stack That Keeps the Scoreboard Honest
You don't need a tower full of instruments. You need four jobs done well, in order, so a familiar or a teammate can't declare victory from a broken counter. Check each job before the first visitor is counted, because a test built on bad tracking teaches you a confident lie.
Four Jobs, Checked in Order
1. Event tracking records the journey. Capture sessions, add-to-cart events, checkout starts, purchases, refunds, and lead quality. Tag each event by device, by new or returning visitor, and by channel, so the scoreboard can be split the way careful reading demands. Test it yourself on your phone and place a real order you'll refund.
2. A split engine runs the fair contest. It should set a clear traffic allocation, such as an even split between control and challenger, and store the primary metric and stop date before launch. When traffic allows, it can hold back a small untreated slice after a winner ships. When you're comparing options, our roundup of A/B testing tools shows what to check before you pay for anything.
3. Session recordings and heatmaps explain the stall. A funnel report says people left at the address step. A recording shows three of them tapping a greyed out button that gives no feedback. That turns a drop-off into a hypothesis instead of a guessing circle around a cauldron. Watch mobile sessions separately, since cramped forms hide there.
4. An accessibility audit combines scan and hands. Run an automated scan, then do manual checks a scanner can't fake. Tab through the checkout using only a keyboard. Read the pay button name with a screen reader. Trigger a form error on purpose and confirm the message appears next to the field and explains the fix.
Connect all four jobs to one decision log. Give it columns for hypothesis, variant, result, and decision, plus the segment check and guardrail reading. A shared spreadsheet beats a fancy dashboard nobody updates. The log is the spellbook. Without it, every new hire retests last year's dead idea and pays for the lesson twice.
Automation can run the split. A person still confirms the tracking is clean before the first visitor is counted.
Reject tools that can't do two basic things. If a tool can't export segment level results, you can't spot a winner that's harming mobile buyers. If it can't show when a test was edited, you can't trust a result that changed mid-flight. Those aren't missing luxuries. They're holes in the castle wall, and a shortcut with holes is a risk dressed as convenience.
When the Oracle Should Not Crown a Winner
Testing velocity is not learning velocity. A warlock who launches five tests on a trickle of traffic and auto promotes the first green bar hasn't learned five things. He's rolled five dice and framed the luckiest one. This is the candid warning small sites need most, because a shiny result on thin traffic is often just noise wearing a crown.
Sample bands make the risk concrete. Data summarized on the Convert A/B testing statistics page shows that about 10% of experiments run with fewer than 1,000 visitors, while the largest group, 37%, uses 10,000 to 50,000 visitors per test. That gap tells you many smaller sites lack the volume to judge numerous page level changes confidently. If your converting traffic is thin, fewer and bolder tests beat a swarm of tiny ones.
Four Impostors That Mimic a Win
- Peeking early: You check hourly and stop at the first flattering gap, which is exactly when random luck looks biggest.
- Novelty spike: Returning visitors click the new thing in week one because it's new, then settle back to old habits.
- Seasonal calendar: A payday weekend or holiday lifts one variant's window and you credit the page for the calendar's work.
- Channel mix shift: A new ad sends warmer traffic mid-test, and the variant that happened to receive more of it looks gifted.
Each impostor has the same cure. Decide the rules before launch, when you're calm and no chart is flirting with you. Write one primary metric. Set a minimum sample or a fixed stop date. Name guardrails such as refunds and qualified lead rate. Keep a holdout slice when traffic allows, and add a short validation window after a winner ships to confirm the lift survives contact with all visitors.
Estimate your sample before launch with a standard calculator. Feed it your baseline rate, the smallest lift worth shipping, and your chosen confidence level. Write the resulting number beside your stop date in the decision log, so the stopping rule is a number you already agreed to obey, not a feeling you'll negotiate with later.
| Situation | Safer method | Guardrail before you promote |
|---|---|---|
| Under 1,000 visitors | Fix obvious friction or use a pre-set before-and-after, not a swarm of splits | Do not auto-promote; expect noise |
| 10,000 to 50,000 visitors, one change | A single A/B test with a fixed stop | Primary metric only, plus refunds or lead quality |
| Sparse purchases | Fewer, bolder tests or qualitative research | Revenue events, not click thrills |
| Agent wants to ship a temporary winner | Human review against the pre-written rule | Rollback path and a validation window |
When a Split Test Is the Wrong Tool
Don't test a broken button. Fix it. Don't test a legal price error or a misleading delivery promise. Correct it, then measure a fixed window if you want the learning. And when you have almost no purchases, a handful of customer interviews or a watched session can teach more in an afternoon than a starved test teaches in a month. Ask buyers what nearly stopped them. That answer often names the dragon directly.
Autonomous agents still have a role here, a supervised one. Let them draft variants, route traffic, and watch the counters. But a person owns the stopping rule, writes the audit note, checks consent aware measurement, and keeps the rollback ready. Auto promotion without those owners isn't magic. It's an unsupervised oracle, and oracles that nobody questions eventually crown noise and tax your hoard for the ceremony.
A Weekly Roadmap for Continuous Optimization
A solo founder doesn't need a laboratory of analysts in matching cloaks. You need a four week cycle small enough to survive a busy month and strict enough to stop random tinkering. Run it, archive it, then run it again. The repetition is where conversion rate optimization CRO compounds, because each cycle spends its effort on the leakiest step you can prove, not the loudest opinion in the room.
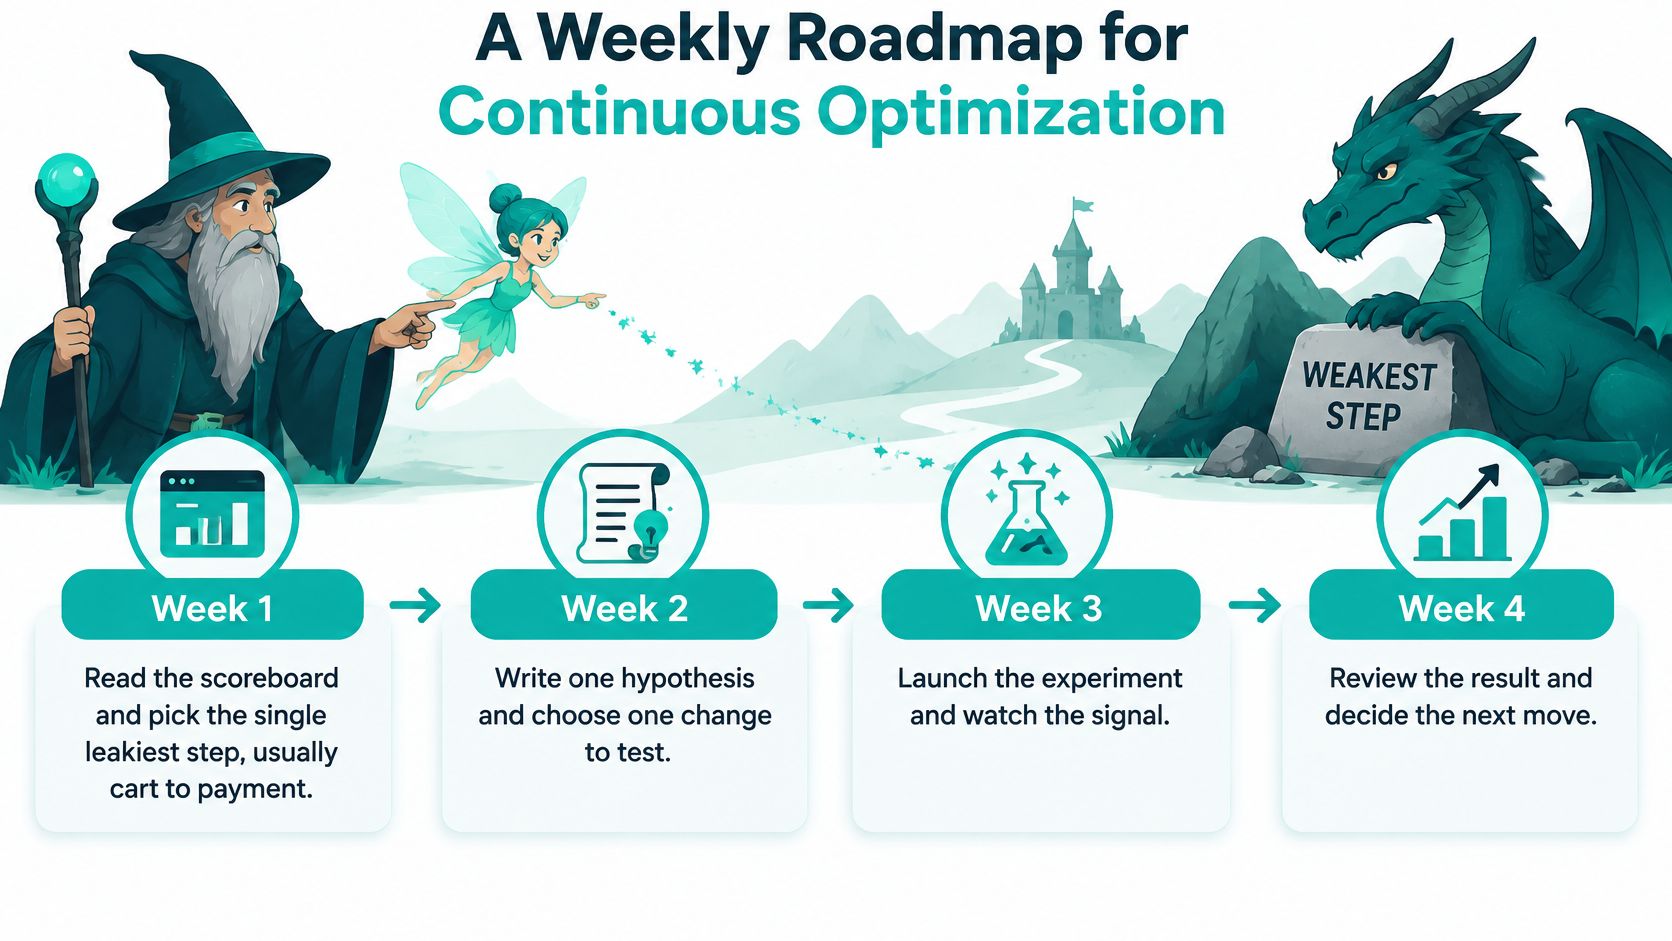
This timeline shows the full month at a glance, from reading the scoreboard to deciding the next move.
The Four Week Cycle
Week 1, read the scoreboard. Pick the single leakiest step, usually the stretch from cart to payment. Split it by device and by new versus returning visitors before you choose. One leak gets the month. Three leaks get a wish list and no fix.
Week 2, write one hypothesis and one challenger. Use the fill in line, name the audience, and keep the change bold enough to detect. A cloud of cosmetic tweaks might lift or sink the result, and you'd learn nothing either way. One challenger keeps the lesson clean.
Week 3, run the split only if traffic can support it. If your sample estimate says the traffic isn't there, don't fake a ritual. Ship the fix as a monitored before and after, with the same guardrails and a fixed window you wrote down in week 2. Honest measurement beats a starved test with a confident chart.
Week 4, promote, retire, or rerun. Then write what you learned in one sentence a future you can trust, such as guest checkout lifted completion for new mobile visitors while refunds stayed flat. Vague notes like the new page felt better are pixie dust. They sparkle and teach nothing.
Four Habits Inside the Month
- Check the primary rate against the same week last period, so a payday weekend doesn't impersonate progress.
- Capture one friction note from support tickets or a session recording, phrased as the exact step where a real person stalled.
- Confirm the live test still has its stopping rule untouched, with the sample target and stop date where you left them.
- Reject any winner that hurts a guardrail, even when the primary rate looks heroic and everyone wants to ship before lunch.
Think of each experiment's lifecycle as five plain stages. It starts as a draft, goes live, gets read at the planned moment, earns a decide call, and lands in the archive. Skipping the archive is how teams retest dead ideas every spring. Skipping the read date is how a test runs until someone gets bored and calls the current leader a winner.
Agent help fits inside those stages as jobs, not as a replacement council. One familiar watches page speed so a slow checkout doesn't poison a test. One reads drop-offs and flags the step where visitors stall. One drafts a challenger variant from your hypothesis. None of them skip the archive note, and none of them override the human stop. The warlock keeps the calendar, the pixies carry messages, and the dragon at the gate gets measured instead of guessed at.
Keep the cycle boring on purpose. Boring means the same scoreboard, the same log, and the same stopping discipline every month, while the hypotheses get smarter. That rhythm turns a pile of one off tweaks into a program. The final step is smaller than a redesign and braver than another planning doc. You launch one supervised experiment, with a stop date, and you let evidence rather than hope close the gate.
Launch Your First Supervised Experiment
A checkout leak gives you a focused place to start. Choose one page, write a challenger based on a specific hypothesis, and decide what result would count as useful before traffic is split. If traffic is too thin for a meaningful comparison, fix an obvious fee or form problem and track the outcome over a fixed window instead.
Describe what the page sells, who arrives, and where visitors stall. Pick one primary metric and a guardrail, such as refund rate, so a rise in conversions does not hide a worse outcome elsewhere.
Web Mage's Conversion Alchemist familiar creates, runs, and promotes A/B split tests automatically. Creating and monitoring one split test costs about 5 credits. Treat the result as a clue to examine, not a spell that guarantees the right decision: check the chosen metric and guardrail before accepting a winner.
Keep a decision log. Record the hypothesis before the test, then note what the results show and what you decide. That turns each experiment into a lesson for the next checkout improvement.
Bring a leaky page to Web Mage. The Conversion Alchemist can create and run a split test, then automatically promote the winning variant and retire the losing one. Review the outcome against your hypothesis and guardrail before carrying the lesson to your next experiment.