
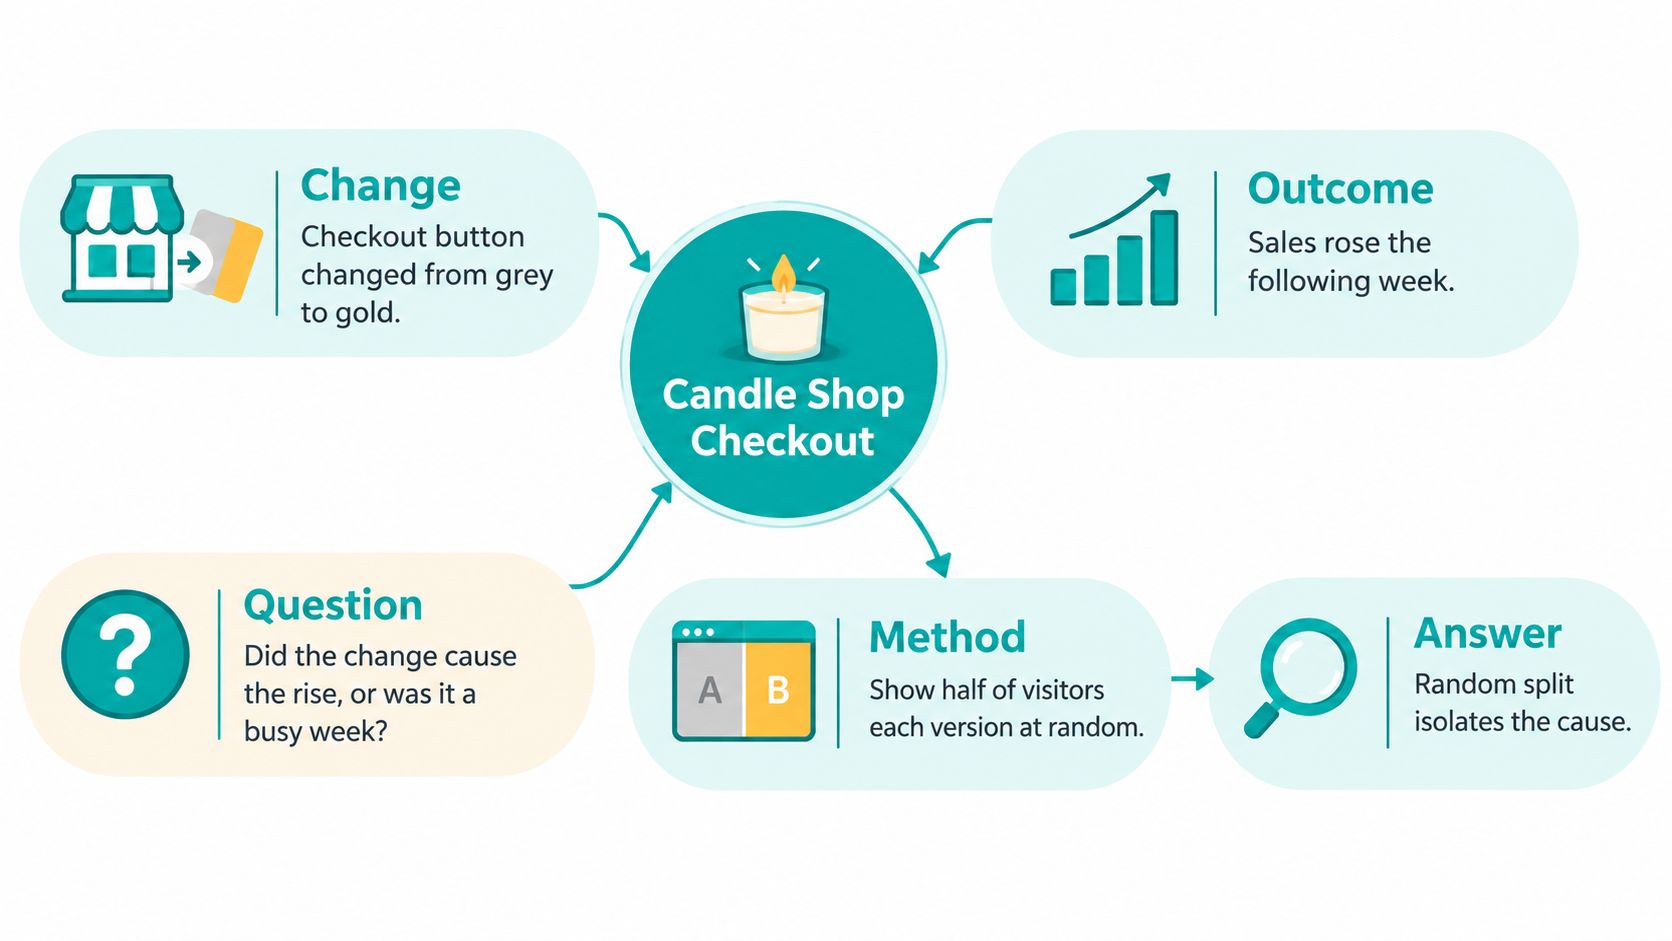
You've changed your candle shop's checkout button from grey to gold, and sales rose the following week. You'd like to congratulate your inner design wizard, but there's a nagging question: did shoppers notice the button, or did you just have a busy Saturday?
That's the problem A/B testing for websites helps solve. You don't need a tower full of analysts to understand it, but you do need fixed casting rules, especially when your site attracts a trickle of visitors rather than a dragon-sized crowd.
Table of Contents
- What a Website A/B Test Actually Does
- The Eight-Step Testing Workflow at a Glance
- Writing a Testable Hypothesis and Picking One Metric
- Sample Size and Test Duration Before You Launch
- Building Variants and Splitting Traffic Fairly
- Reading Results Without Fooling Yourself
- Automating Tests With Tools and Autonomous Systems
- Choose and Launch Your First Test This Week
What a Website A/B Test Actually Does
Instead of showing everyone the gold button and comparing this week with last week, show the grey and gold versions at the same time. Randomly assign incoming visitors to either the original checkout or the changed checkout, then compare a predefined outcome, such as completed purchases.
Think of assignment as a fair coin flip. Heads gets the original spellbook; tails gets the new one. With enough visitors, the groups should look similar on average, including differences you can't directly measure, such as purchase intent.
The candle shop's test looks like this:
Why Random Assignment Matters
If you show gold only to returning customers, you haven't isolated the button's effect. Returning customers might already trust your shop more. Likewise, comparing different weeks mixes the design change with payday, weather, advertising, and everything else happening outside your browser.
Random assignment makes a causal explanation more credible, provided tracking works and both groups receive comparable treatment apart from the intended change. It doesn't guarantee identical groups or remove sampling noise.
The roots go back to Ronald A. Fisher's experimental work in the 1920s, followed by online experiments emerging in the late 1990s and Google's reported search-results test in 2000, as described in this history of online controlled experiments.
The Vocabulary in Your Spellbook
- Control: The existing experience, usually called A.
- Variant: The changed experience, usually called B.
- Primary metric: The outcome you'll use to judge the experiment.
- Lift: The difference in performance, often expressed relative to the control.
- Statistical significance: Evidence that the observed difference would be unusual under a model where the versions perform equally.
A fair allocation is the foundation, not the entire building. You also need reliable measurement, enough observations, and an honest stopping rule.
If assignment is rigged, no impressive dashboard can rescue the verdict. A glittering chart built on biased groups is still a pumpkin.
The Eight-Step Testing Workflow at a Glance
A useful experiment starts before you open a page editor. The most expensive mistake is polishing a variant for a test that your traffic, tracking, or business goals can't support.
Use this workflow as your casting checklist:
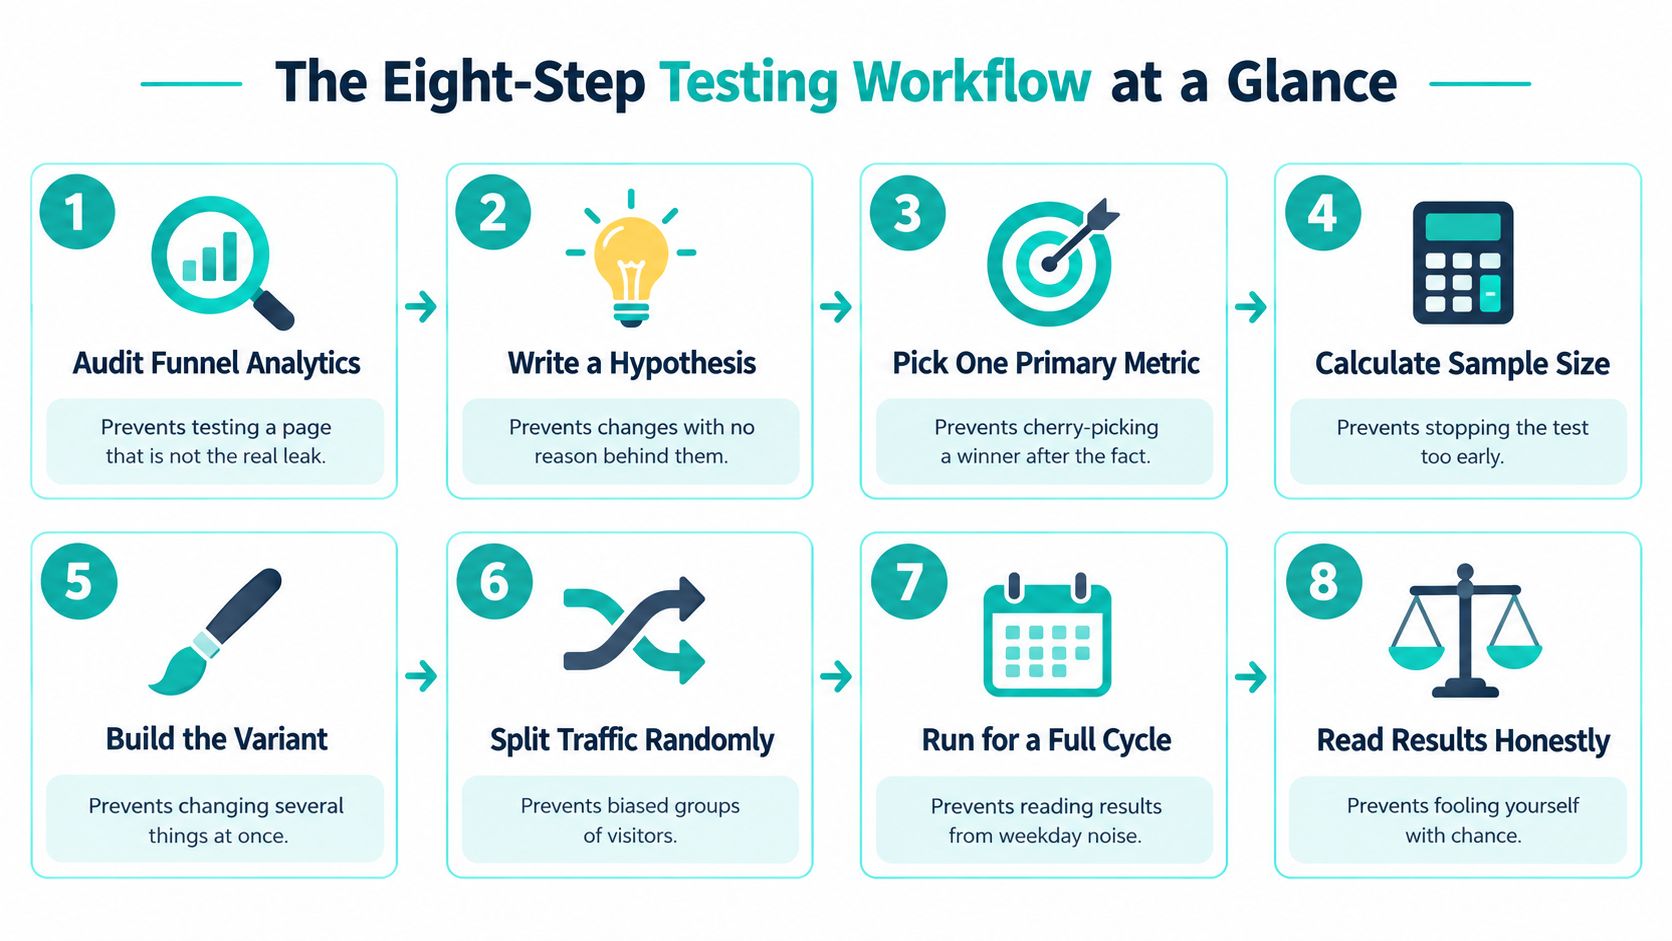
- Audit the funnel. Use funnel analytics to find a busy step where visitors abandon an important task, rather than choosing a page because its design annoys you. This prevents spending scarce traffic on a page few potential customers reach.
- Write a hypothesis. Name the visitor problem and the specific change you expect to help. This prevents random tinkering disguised as experimentation.
- Choose the scorecard. Lock one primary metric and two or three guardrails, such as purchase completion, refunds, or qualified leads. This prevents choosing whichever result happens to look flattering.
- Calculate feasibility. Set the minimum detectable effect, significance level, and power, then calculate the required sample and expected duration. This prevents launching a test that can't answer your question within a useful window.
- Build one meaningful change. Make the variant address the hypothesis directly, whether that means clearer shipping information or a simpler form. This prevents bundling unrelated ideas into an uninterpretable result.
- Assign visitors randomly. Verify allocation and tracking, then launch without changing the experience midway through the experiment. This prevents biased groups and moving targets.
- Follow the stopping rule. Reach the planned sample while covering complete business cycles, or finish at the predefined time cap and accept an inconclusive result. This prevents declaring victory after an unusually cheerful afternoon.
- Validate before promotion. Check the result, business impact, and guardrails before deploying, then monitor the promoted experience. This prevents mistaking a temporary conversion bump for a durable improvement.
Find Your Current Bottleneck
The first four steps happen before visitors see anything new. A test can be technically flawless and still be useless because nobody defined what decision it should support.
Ask yourself what you can't yet write down:
- No clear visitor problem: Inspect funnel reports, support questions, and session recordings.
- No agreed success measure: Resolve the hypothesis and metric choice before building.
- No credible finish date: Calculate sample requirements before buying another testing tool.
- No deployment criteria: Decide what evidence would justify replacing the control.
Keep a short experiment record with the hypothesis, audience, metric definitions, allocation, stopping rule, and owner. You should be able to hand it to a colleague without needing to explain what you meant over a hurried call.
For a visual walkthrough, use this companion video:
Writing a Testable Hypothesis and Picking One Metric
Start with a sentence you can score:
Because [visitor insight], changing [element] to [specific change] will increase [primary metric] by about [minimum effect] for [audience].
For example, suppose session recordings suggest mobile shoppers scroll past essential pricing information. Your hypothesis might be that moving the price above the fold will raise mobile add-to-cart rate by 8 to 10% relative. That's a hypothetical target, not a promised result.
The important part is the chain of reasoning: a visitor encounters a problem, you remove that problem, and you predict an observable behavior. A vague ambition such as making the page better doesn't identify what success means.
Choose the Outcome Before Casting
Write the hypothesis before launch so the result can contradict you. If you redefine success after seeing the dashboard, you're no longer evaluating the original prediction.
Nielsen Norman Group's A/B testing guide identifies conversion rate, click-through rate, bounce rate, retention rate, and revenue per user as common metrics. The right choice follows the visitor's task and the decision you're making.
Common website test metrics and when to make them primary
| Metric | What It Measures | Best Primary Choice When |
|---|---|---|
| Conversion rate | Share of visitors who complete the goal | Checkout, signup and purchase tests |
| Click-through rate | Share of visitors who click a link or button | Navigation, call-to-action and menu tests |
| Bounce rate | Share of visitors who leave after one page | Guardrail or diagnostic, rarely primary |
| Retention rate | Share of users who return over a set period | Onboarding and product-flow tests |
| Revenue per user | Average income generated per visitor | Pricing, upsell and bundle tests |
Define the denominator and measurement window explicitly. An add-to-cart rate among eligible product-page visitors isn't interchangeable with an add-to-cart rate across the whole site.
For the design reasoning behind a variant, connect conversion rate optimization with user experience. A persuasive hypothesis explains how the change helps someone complete a task, not merely why the designer likes it.
Give Your Primary Metric Guardrails
Bounce rate can mislead. Someone might read a clear answer and leave satisfied; also, analytics systems don't all define bounce identically, so confirm your tool's definition.
Revenue metrics need context too. A promotional page might increase average order value while fewer visitors purchase. Revenue per user helps combine those effects, but you should still inspect purchase completion, margin, and refunds.
Your Conversion Alchemist should choose the spell's intended outcome before casting. Guardrails then catch a supposed win that attracts poor-quality leads, encourages costly returns, or makes the next funnel step harder.
Sample Size and Test Duration Before You Launch
An A/B test needs enough eligible visitors to separate a real improvement from a lucky coin toss. The required sample depends on the question you're asking, especially the current conversion rate and the smallest lift worth detecting.
Adobe's sample-size guidance recommends planning with four inputs. A typical setup uses a two-sided significance level of 0.05, 95% confidence, and 80% power. In Adobe's example, a 3% baseline and 10% relative uplift require roughly 51,486 visitors per variation.
Set the Four Inputs
- Baseline conversion rate: The current rate for the exact audience and goal in your test.
- Minimum detectable effect: The smallest improvement you want the experiment to reliably detect.
- Significance level: The false-positive tolerance used by the statistical procedure.
- Power: The probability of detecting the planned effect if it exists under the model.
Set the MDE according to implementation costs and business value, rather than choosing an appealing number. Detecting a smaller lift requires more traffic. Each variation also needs its own sample, so don't mistake a per-variant requirement for the total experiment traffic.
Visitors needed per variant at 95% confidence and 80% power
| Baseline Conversion Rate | Relative Lift to Detect | Visitors per Variant |
|---|---|---|
| 1% | 10% | Roughly 163,000 |
| 1% | 20% | Roughly 42,700 |
| 3% | 10% | 51,486 |
| 3% | 20% | Roughly 13,000 |
| 5% | 10% | Roughly 31,500 |
| 10% | 10% | Roughly 14,800 |
The roughly 13,000 visitors per variation estimate for a 3% baseline and 20% relative improvement is also discussed in Impinge Solutions' small-business testing guide. Calculator methods can differ slightly, so use one method consistently. Treat these rounded examples as planning estimates, not universal constants.
The table's figures are approximate requirements for each version, not the combined total. Record the required sample before launch, then let the spell run to that target rather than stopping when an early result looks promising.
Convert Traffic Into a Calendar
Divide the total required visitors by daily eligible visitors, not all website sessions. For instance, a mobile product-page test can count only visitors who qualify to see that experience.
Round the time estimate up to cover full weeks and relevant business cycles. If conversions take time to mature, allow visitors to complete their purchase or onboarding journey before analyzing results.
As a planning approximation, halving the MDE roughly quadruples the sample requirement. On a low-traffic site, that can make a subtle effect too costly to detect. A stronger intervention may be a better spell to cast.
Practical rule: Treat about eight weeks as a planning checkpoint, not a statistical law. If the forecast runs longer than you can responsibly wait, choose a stronger intervention or use another research method.
Low traffic changes which questions you can answer economically. Choose a test whose required sample fits the audience you can realistically reach, then judge the result against that plan.
Building Variants and Splitting Traffic Fairly
Don't expect every clever tweak to summon a conversion dragon. A Wharton-affiliated study summarized by Omniconvert examined 2,732 e-commerce tests from 252 companies and reported a median absolute effect size of 0.1% and a mean effect size of 0.7%.
Those findings don't mean small changes never matter. They mean you shouldn't build your testing calendar around dramatic lifts from cosmetic adjustments.
Change Something That Could Change Behavior
Use one meaningful intervention per variant. Showing delivery costs before checkout addresses a purchasing concern; changing a decorative border usually doesn't address an obvious visitor obstacle.
A meaningful intervention can include coordinated elements. For example, a redesigned shipping-information panel may need a heading, delivery estimate, and clearer placement. You can test that package, but you can't claim the result identifies which individual element caused the difference.
Reserve multivariate experiments, which compare combinations of changes, for situations where you can support the extra traffic and analytical complexity.
Traffic allocation options
| Split | Appropriate Use | Trade-Off |
|---|---|---|
| 50/50 | A control and one variant testing a clear hypothesis | Efficient comparison with equal exposure |
| Three-way | A control and two distinct alternatives | More total traffic and comparison planning |
| 80/20, control-heavy | A risky change on a revenue-critical page | Less downside exposure, slower learning |
These are allocation choices, not performance benchmarks. A three-arm experiment comparing ideas needs more traffic than a simple comparison, and a control-heavy design must be powered for its unequal allocation.
Keep Assignment Stable
Use a persistent cookie or user ID so returning visitors remain in the same group where feasible. Switching someone between experiences can confuse the visitor and muddy attribution.
Avoid flicker, where the original page appears before the variant loads. Test rendering on slower connections, not just your developer's laptop.
A hypothetical 50/50 allocation producing a 52/48 split across 100,000 visitors deserves an immediate sample-ratio investigation. At that scale, don't dismiss the imbalance as ordinary coin-flip variation; check assignment, eligibility, redirects, and missing events.
Before launch, complete a practical check:
- Desktop and mobile QA: Confirm layout, forms, payment flows, and accessibility work.
- Tracking parity: Trigger the same conversion events on both versions.
- Campaign consistency: Avoid unplanned offer or targeting changes during the experiment.
- Operational readiness: Name the person who can pause the test if checkout breaks.
Keep allocation fixed unless your chosen statistical method explicitly supports changing it. Don't secretly feed extra traffic to the apparent leader.
Reading Results Without Fooling Yourself
A dashboard can show a lead long before you have credible evidence. A fair coin can also produce a surprising streak without becoming enchanted.
The conventional p-value threshold below 0.05, described in Typenorm's A/B testing guide, means that, assuming equal performance and the test's other assumptions, a result at least this extreme would occur with less than 5% probability. It doesn't mean there's a corresponding probability that your variant is better.
That distinction matters. A p-value describes compatibility with a statistical model, not the profitability of implementing a design.
Don't Stop at the First Sparkle
In a representative simulation discussed in Aaron Defazio's sequential-testing paper, 10 repeated looks can raise the cumulative false-positive rate to approximately 17%, rather than the intended 5%, when you stop at the first significant result.
You may monitor the experiment for broken pages or tracking failures. The problem is repeatedly asking whether you've won and ending the test the moment the answer looks favorable.
Use a fixed-horizon analysis or a valid sequential method with adjusted stopping boundaries. Sequential testing is a different procedure, not permission to peek at an ordinary significance dashboard.
Keep Comparisons Under Control
Testing many metrics creates another route to accidental winners. As an illustrative calculation, ten independent tests at a 5% threshold give roughly a 40% chance of at least one false positive, calculated as one minus the probability that none crosses the threshold.
Real website metrics are often correlated, so that calculation isn't an exact forecast for your dashboard. The lesson remains practical: don't shop among outcomes until you find a flattering result.
Use this checklist before promotion:
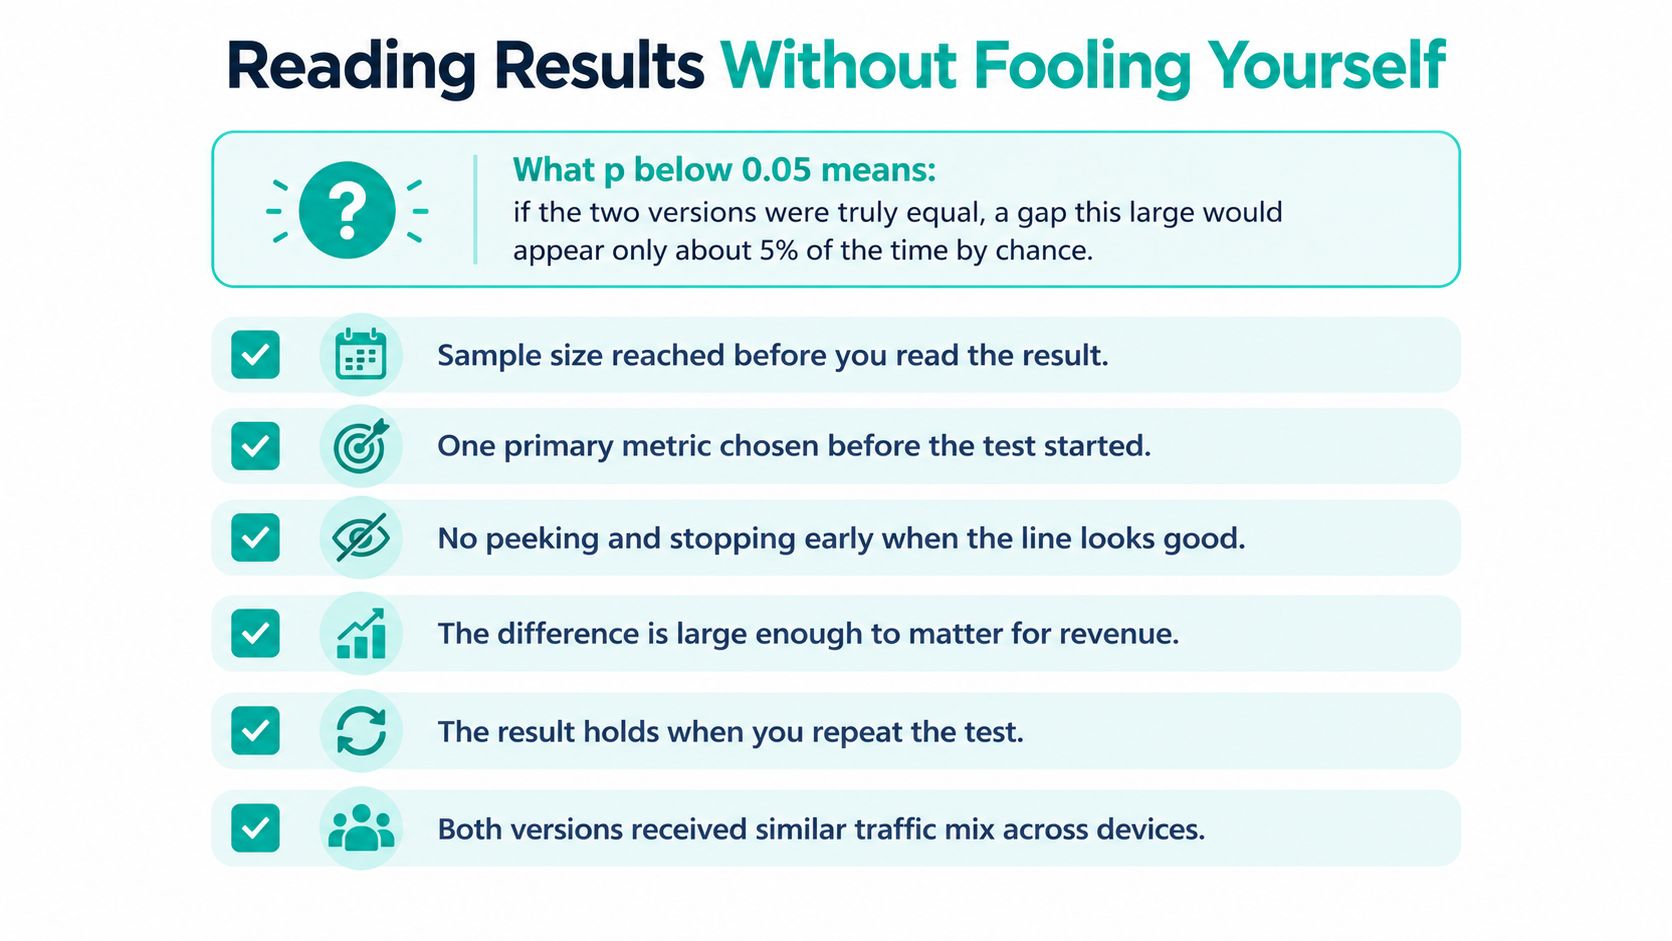
- Stopping condition: The required sample and timing conditions are satisfied, or the time cap has ended without a winner.
- Business cycles: The test represents recurring weekday, weekend, and purchasing patterns.
- Sample ratio: Observed allocation is consistent with the planned split.
- Guardrails: The variant hasn't caused unacceptable harm to downstream outcomes.
- Segments: Unplanned mobile, desktop, new-user, or returning-user findings remain exploratory.
- Commercial value: The plausible improvement justifies implementation and maintenance costs.
Read the Range, Not Just the Badge
Suppose a hypothetical result shows 6% relative lift, with a confidence interval from 0.5% to 11.5%. The estimate is positive, but the plausible effect includes an improvement that may be too small to justify an expensive rebuild.
Compare the low end of the range with your costs and risk tolerance. For practical implementation decisions, use a conversion-rate optimization process that connects visitor behavior with business outcomes.
A statistically detectable difference isn't automatically a worthwhile business decision.
If the result is inconclusive, record it and keep the control. Don't call the pages equivalent unless your analysis supports that conclusion; instead, document which effect sizes remain plausible and improve the next hypothesis.
Automating Tests With Tools and Autonomous Systems
You can run website experiments through a specialist platform, a builder's built-in split test, or an autonomous optimizer. The useful distinction is who makes each decision, not how many sparkling buttons appear in the interface.
Ways to run website tests and who makes the decisions
| Approach | Who Writes Variants | How Winners Are Chosen | Best For |
|---|---|---|---|
| Standalone experimentation platform | Your team or designer | Statistics engine you configure, promotion decided manually | Teams with steady traffic and an analyst |
| Page builder or CMS split test | Your team | Basic built-in significance, reviewed by hand | Small sites wanting quick, simple tests |
| Autonomous optimizer, such as Web Mage's Conversion Alchemist | AI drafts variants from a prompt | Traffic allocated, significance tracked and winners promoted automatically | Solo founders and agencies without an analyst |
Individual tools differ in their statistical methods and controls. Verify how a product handles stopping, multiple variants, and promotion instead of assuming every significance label means the same thing.
The decision paths look like this:

What the System Can Handle
Automation is useful for drafting alternatives, maintaining allocation, collecting outcomes, and carrying out configured decisions. It reduces the chance that someone forgets an experiment exists while juggling client work.
The Conversion Alchemist drafts A/B variants from prompts, allocates traffic, tracks significance, promotes winners, and retires underperformers. The Analytics Oracle surfaces drop-offs that can suggest the next hypothesis.
The publisher's A/B testing tools guide provides a starting point for evaluating tooling; its plan starts at $8 per month with 500 credits. Match the workflow to your needs, and verify the controls available before enabling automatic promotion.
A system that can produce variants quickly can also produce more comparisons than a human can responsibly review. Faster spellcasting doesn't remove the need to inspect the spell.
Separate Significance From Promotion Confidence
Industry figures discussed in Jordan Glickman's analysis of e-commerce testing report 18% of tests finishing below 90% confidence and 60% delivering less than a 20% lift. Those figures aren't a forecast for your site, but they caution against expecting large, certain wins from every experiment.
Promotion confidence is an operational judgment about whether deployment is safe and worthwhile. It includes statistical evidence, but also revenue quality, technical reliability, traffic context, and whether the result persists.
Give an autonomous system explicit conditions:
- Decision contract: Supply the hypothesis, primary metric, guardrails, and stopping rule.
- Validation gates: Require sample-ratio checks and planned segment review before deployment.
- Follow-up: Retain a holdout where practical or schedule a post-promotion evaluation.
As an editorial operating recommendation, schedule a review after two to four weeks of post-promotion observations, extending it when outcomes mature slowly. Without a randomized holdout, monitoring can reveal problems, but it can't by itself prove the original lift persisted.
The system can write the variant. You still own the decision.
Choose and Launch Your First Test This Week
Start with the traffic you have today, not the experimentation program you hope to run someday. Use these bands as planning heuristics, not statistical guarantees, because baseline conversion and eligible traffic still determine feasibility.
First test to run by monthly visitors
| Monthly Visitors | Best First Move | Minimum Lift to Plan For | Watch Out For |
|---|---|---|---|
| Under 5,000 | Bold redesign of one page, or interviews and session recordings first | 20%+ relative | Reported benchmarks suggest about 80% of such tests fail to reach significance |
| 5,000 to 50,000 | One high-impact change on the busiest funnel step | 10 to 20% relative | Full business cycles and sample-ratio checks |
| 50,000 to 500,000 | Multi-step or segment tests with pre-set stopping rules | 5 to 10% relative | Guardrail metrics and post-launch holdouts |
| Over 500,000 | Continuous program with automated variants | 2 to 5% relative | Multiple comparisons and promotion confidence |
The low-traffic caution comes from Inspectlet's A/B testing guidance, which reports that about 80% of tests run by businesses with fewer than 5,000 monthly visitors fail to reach significance. The remaining traffic bands and lift targets are suggested planning categories, not measured success rates.
Choose a Question Your Site Can Answer
If the planned duration exceeds the time you're willing to wait, narrow the experiment's scope, make the intervention more substantial, or switch to research. Don't lower your evidence standard merely because the visitor counter moves slowly.
For a small coaching site, interviews may reveal that prospective customers can't tell what the consultation includes. Clarifying that offer could be a more sensible first move than splitting scarce traffic between nearly identical button colors.
For a busier shop, the strongest candidate might be an earlier delivery estimate on the most visited product page. Focus on a decision with enough reach and a plausible behavioral mechanism.
Put the Review Date on the Calendar
Solo founders, small businesses, and agencies managing client sites can use built-in split testing to reduce setup work. They still need to supply a hypothesis, a primary metric, and a stopping rule before sending visitors into the experiment.
Keep your first test deliberately manageable. Assign an owner, preserve the original page, and write down what you'll do if the result is positive, negative, or inconclusive.
This week's assignment: Write one hypothesis, pick one metric, calculate the sample size, and put the review date on the calendar.
If the calculation says a conventional test isn't feasible, you've still made progress. You've learned which spell your current traffic can support, before spending weeks waiting for a lucky coin toss to look convincing.
Web Mage combines prompt-built websites and funnels with built-in split testing, so you can create and evaluate variants without assembling a separate testing stack. Visit Web Mage with one clear visitor problem and your experiment's casting rules ready, then build a test you can judge fairly.